
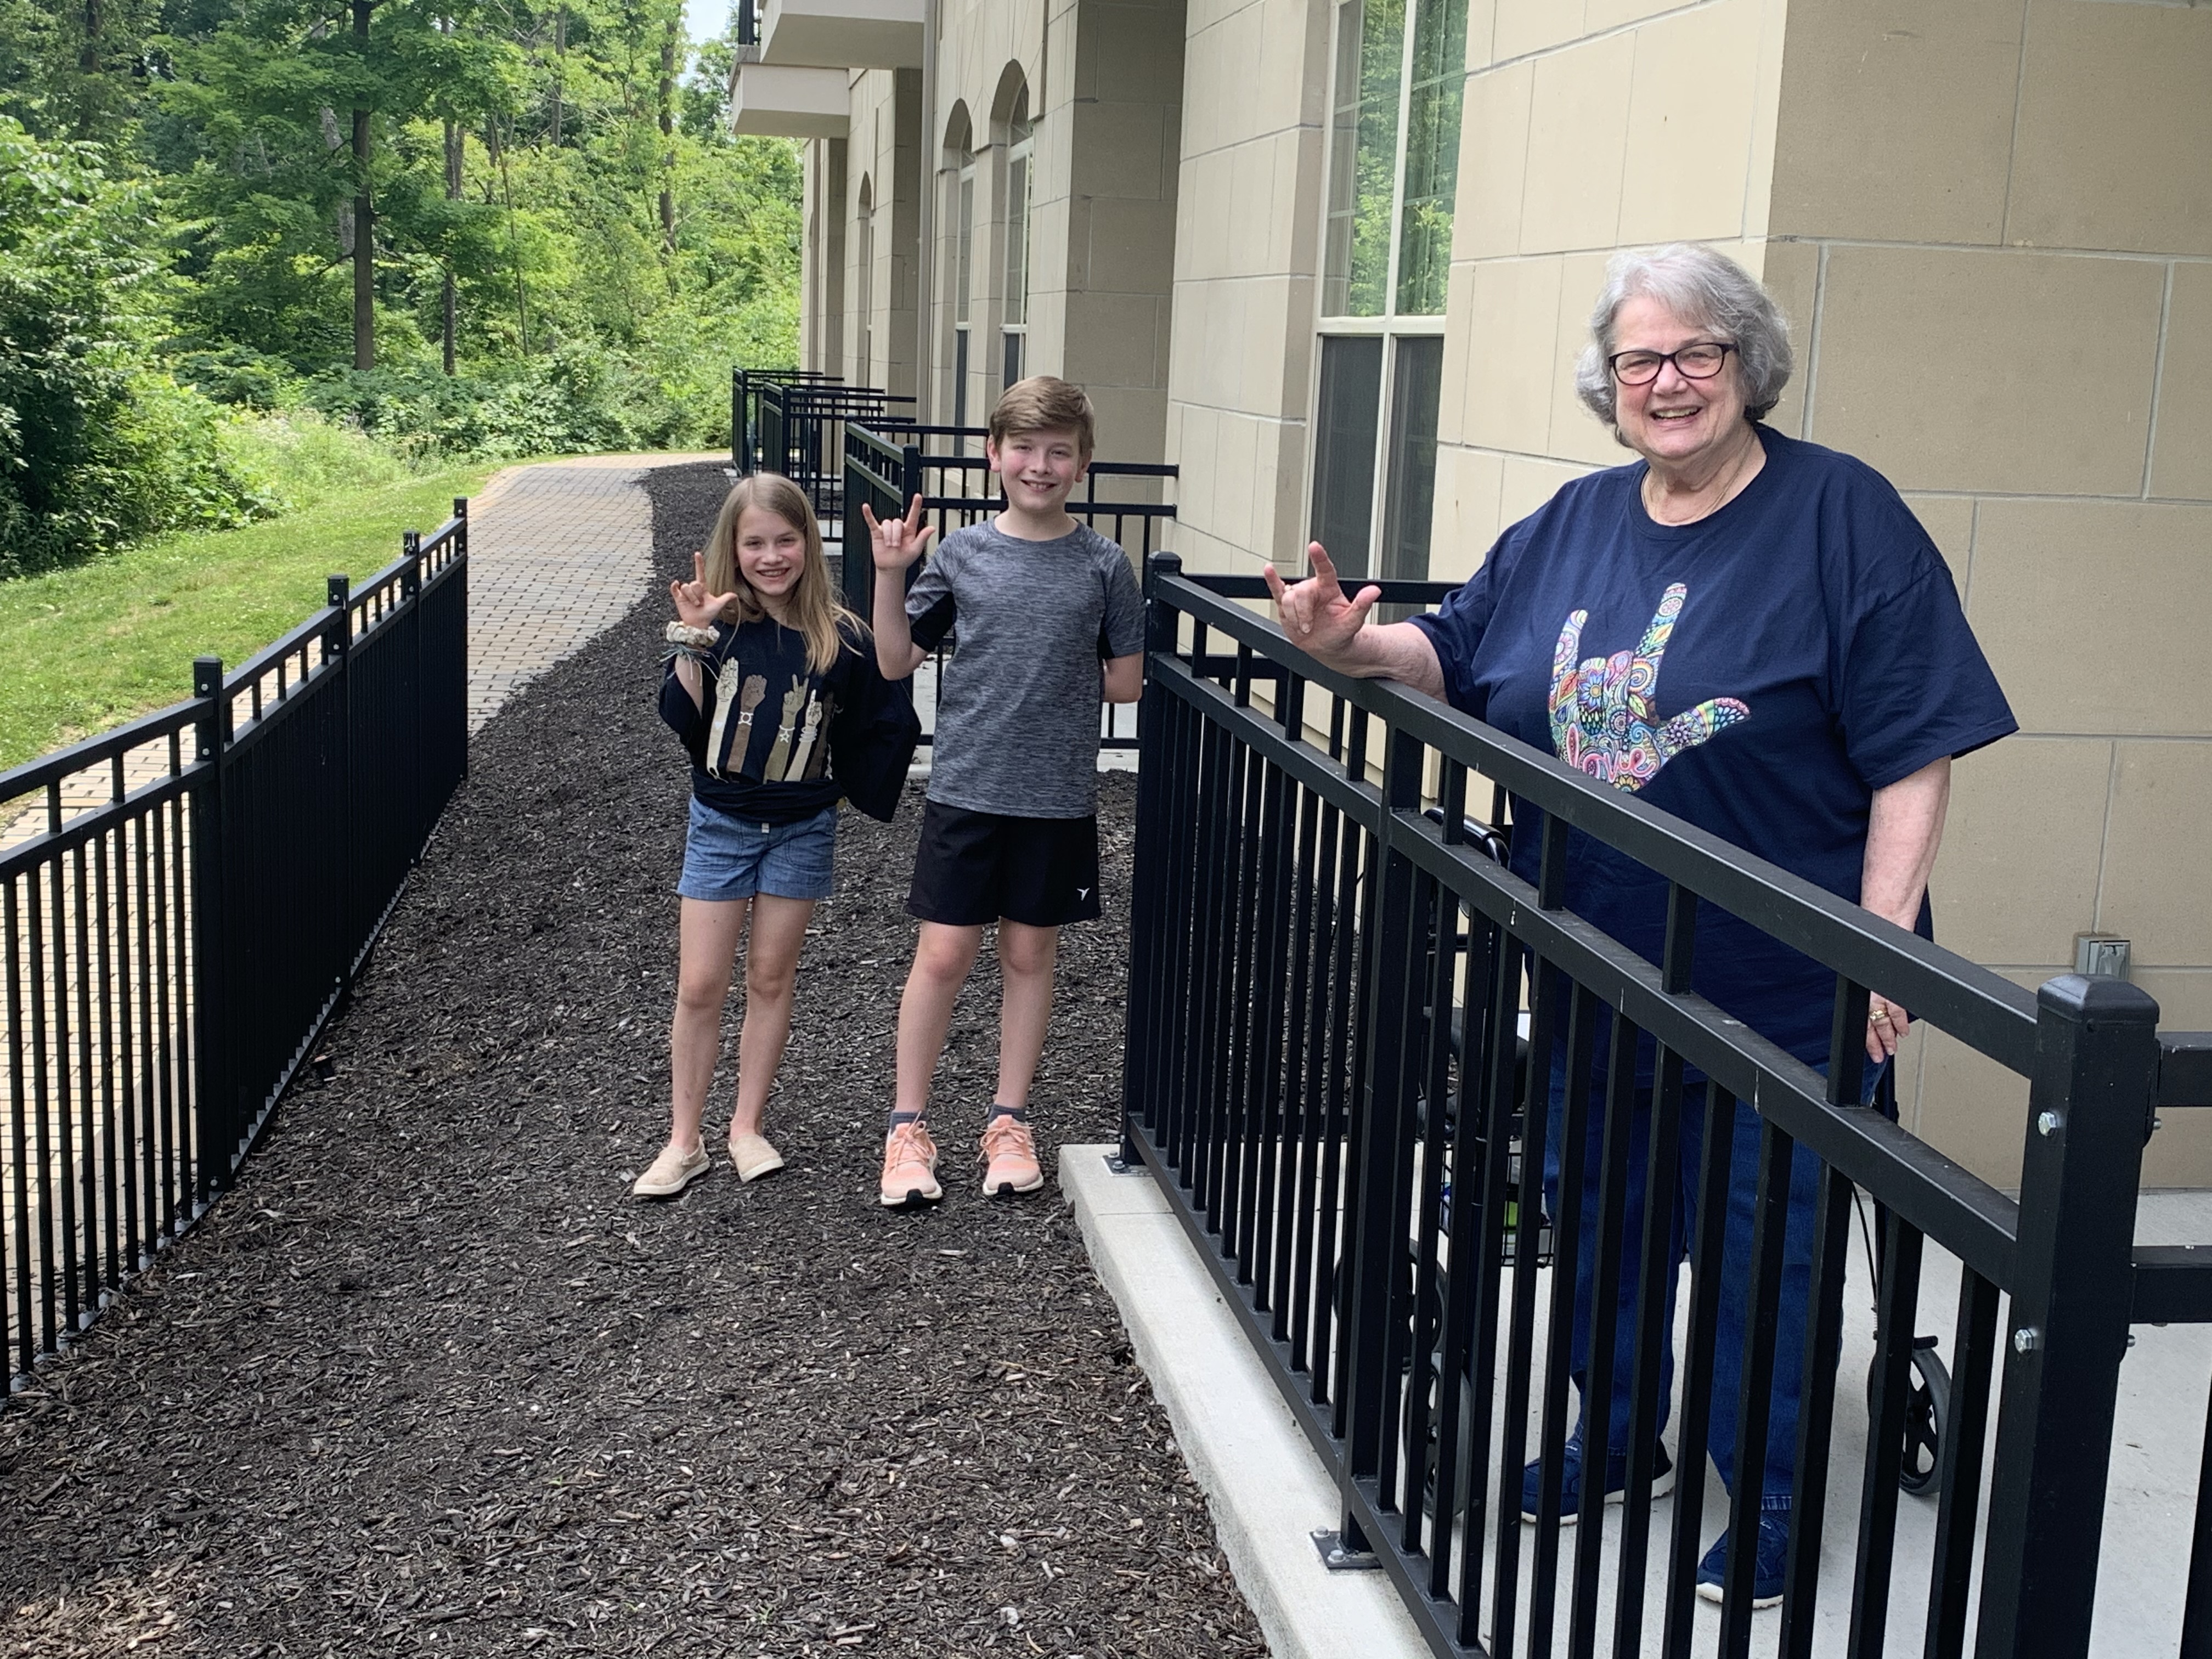
John McKnight and I once talked about the institutions we build for people who are not at work. John spoke plainly. One idea of his stayed with me for years. He described child care centers, nursing homes, and adult day programs as vacuums that pull the treasures of a community, its children and its grandparents, out of the places where everyone else lives and into buildings made just for them. When that happens, the rest of us go through most of our day without a child or an elder in it.
In Marion County, Indiana there are about 136,000 children between the ages of five and fourteen and about 125,000 adults sixty-five and older, which together is more than one in four people in the county. On a weekday, most of the people I see at work, on the road, in the lunch line, and at the store are between twenty-five and sixty-five. The children are in school and then in afterschool programs, many of the elders are home alone or in a day program, and the ordinary places of the city are left to people of working age.
I have worked in Indianapolis neighborhoods for about thirty-five years. I started at fifteen, teaching photography with Bill Rasdell to kids at The Meadows apartments, and later I served on the Indiana afterschool board. With Mike Mather and De'Amon Harges, I helped start the Zawadi Exchange at Broadway United Methodist Church, where we began with the gifts neighbors already had. On the afterschool board we worked hard to fund more slots and drive program quality through the roof. Underneath that work sits a question we rarely asked, which is how we came to hold our children and our grandparents in separate buildings at all.
What the Data Shows
- The wage pulled the young away from the grandparents. Almost 70 percent of American elders lived with a grown child in 1850, and 13.6 percent of Indiana elders do today, and the main cause was the move from farming to wage work.
- Twice as many Indiana elders live alone, 28.7 percent, and the state has one adult day place for every 166 of them.
- Congress paid for afterschool only after women's paid work had risen for fifty years, gave working parents as its first reason, and has let the money lose 28 percent of its value since 2002.
- The people paid to hold children and elders earn about half to three-quarters of the typical Indiana wage, and nearly all of them are women.
- Holding the old has become a growth business. Elder-care jobs in Marion County grew more than eightfold from 1998 to 2023 while child care stayed flat, and those jobs are filled mostly by workers from the middle-ring townships, while many of the businesses sit on the wealthy north side.
- The laborless have no fixed age. Almost half of Indiana's adult day participants, 43.6 percent, are working-age adults with disabilities.
How the Wage Pulled Young People Away From Elders
The sociologist Steven Ruggles counted, census by census, how many older Americans lived with a grown child. In 1850 almost seventy percent of people sixty-five and older did, and by 1950 it was about a third. The share kept falling after Social Security began in 1935 and after Medicare and Medicaid passed in 1965, and by 1990 it had settled near fourteen percent. Indiana sits at that level today, where 13.6 percent of people sixty-five and older, about 165,000 out of 1.2 million, live with a grown child.

Twice as many Indiana elders live alone, 28.7 percent, or 349,105 people, and in Marion County the share is almost one in three. In 1850 most of these men and women would have spent the afternoon in a house with their children and grandchildren, minding the baby, cooking, and telling the older children about their family. Today many of them spend it by themselves.
Ruggles also asked why this happened. The common story says older people got richer, through Social Security and pensions, and chose to live on their own. Ruggles tested that story against the census and found it explains very little. By his estimate, Social Security accounts for at most 4 to 6 percentage points of the change, less than 13 percent of the decline since 1936. The main cause was wage labor. In 1800 about three out of four American workers farmed, and by 1980 about two out of a hundred did. A son who would inherit his father's farm had a reason to stay, and a son who could earn a wage in town did not. From 1950 to 2000, the income and schooling of young men by themselves can account for the whole decline in his state models. The wage pulled the young away from the grandparents.
Social Security and Medicare still mattered, because they gave older people an income and some independence once the young were gone. Something else left the household along with the young. The grandparents lost their daily place in the life of the family, the children lost an adult who had time for them, and the street lost one of the people who were home all day and knew every child on the block.
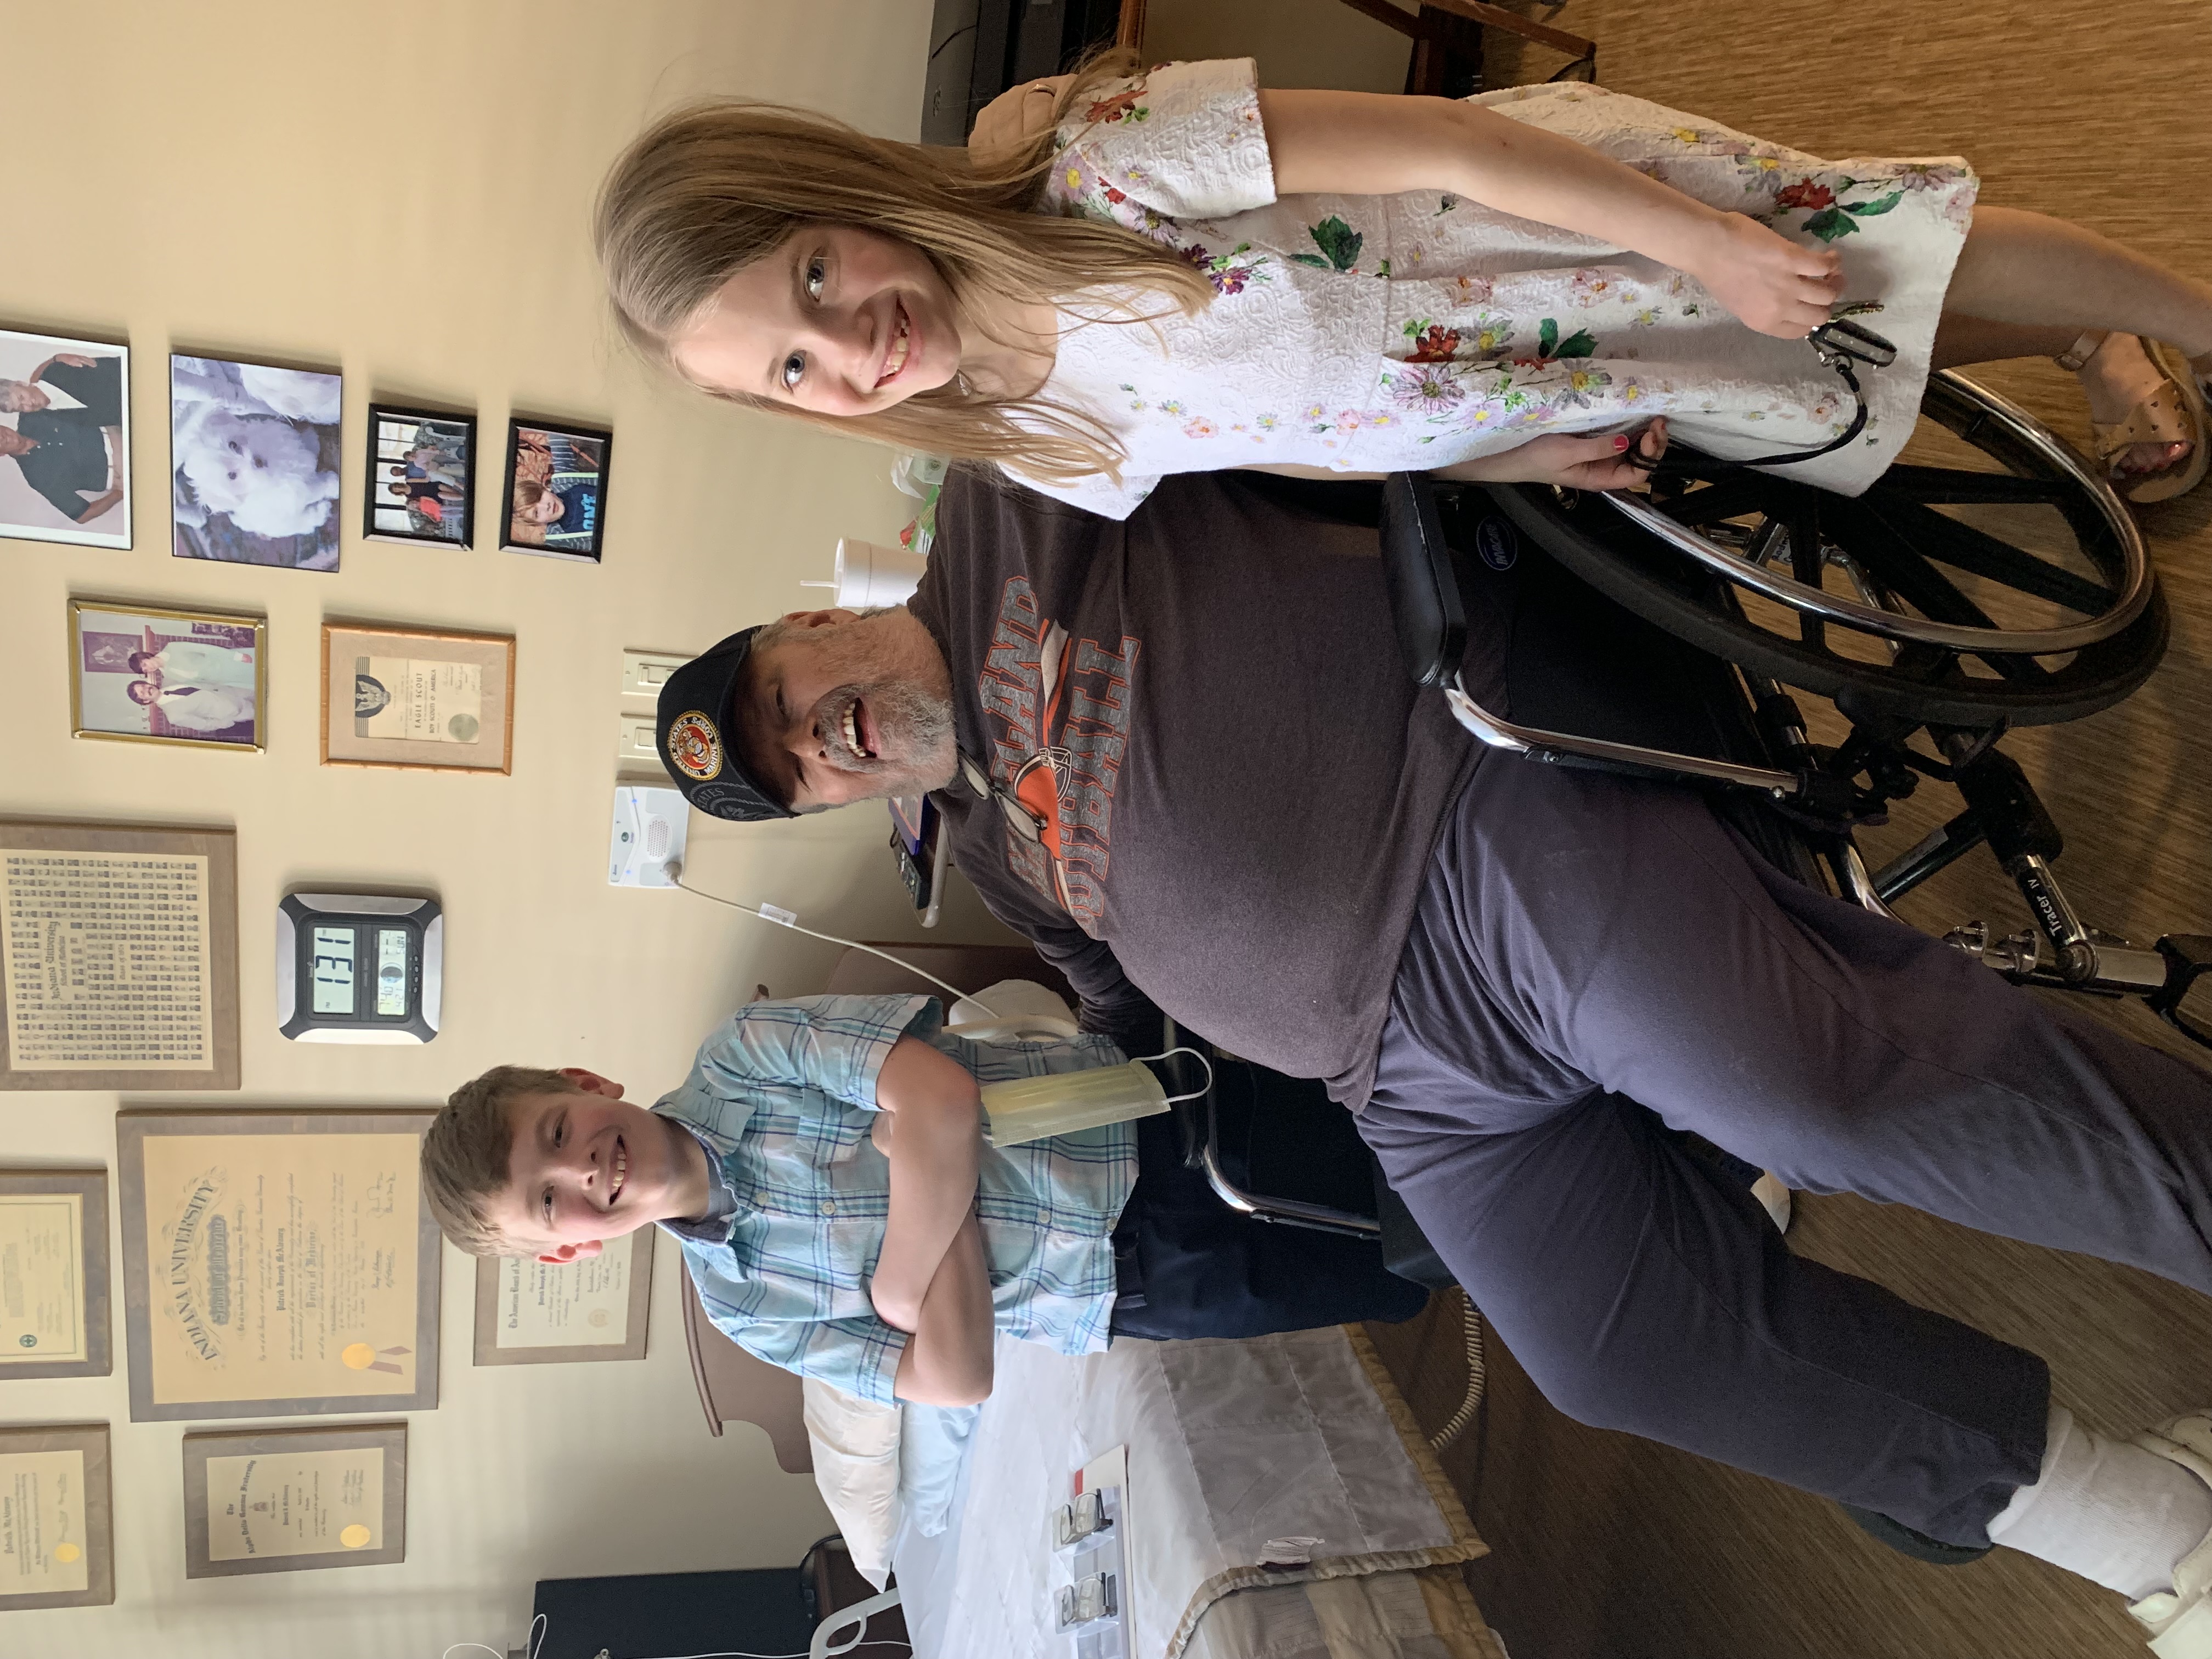
How the Children Were Fitted to the Workday
Women have always worked. For most of American history their work raised the children, nursed the sick, cared for the old, kept the house, and fed the farm hands, and none of it drew a wage. Black women also worked for wages long before the rest of the country noticed women in the labor force. From 1870 to 1900, about 40 percent of Black women were in the paid labor force, compared with fewer than 15 percent of white women, most of them working in fields and as domestic workers in other families' homes. What changed after World War II was how much of all women's work was paid. In 1948, 32.7 percent of American women were in the paid labor force, and by 1999 it was 60 percent.
The workday itself was built around a worker who had someone at home doing the unpaid care. For most of the century that assumed a heterosexual, nuclear family with a cis gender man going to "work" and a cis gender woman staying home. Nobody called a father's eight-hour shift a gap in child care. Once both parents held paid jobs, the school day and the workday stayed as they were, and the hours in-between became a problem for the whole family to solve. Family abolitionists would point to this as a signature finding for the demolition of the nuclear structure in favor of a village or tribe understanding of "the family". Regardless, until federal funding was present, families solved this gap themselves with grandparents, neighbors, older brothers and sisters, churches, and the Boys' Club, and most of that care was still given by women. They were still able to build a little village around the young person.
Apart from a few wartime years in the 1940s and some child care help for poor families, the federal government had no real program for those hours until 1998. That year Congress gave $40 million to the 21st Century Community Learning Centers, and by 2002 the program had $1 billion. When the Clinton administration asked for that money, the first reason it gave was that 23.5 million school-aged children had parents in the workforce in 1995, and crime, drug use, and test scores were listed after that. The program was built to cover the workday.
Women's work rose steadily for fifty years, leveled off near 60 percent in the late 1990s, and only then did the federal money arrive, rising from $81 million to $1.85 billion in today's dollars in four years. The same chart shows men's work falling from 86.6 percent to 67.1 percent over the whole period, so the paid workforce today holds a smaller share of men and a larger share of women than in 1948, and the household lost the daytime presence of both. This timeline does not explain congressional behavior. The Clinton administration's own first reason, working parents, is the best evidence we have of what lawmakers had in mind.
Funding reached its high point in 2002, when that $1 billion was worth about $1.85 billion in today's dollars. Congress has kept the program close to flat since then, and in 2026 it receives $1.329 billion, so inflation has taken about 28 percent of its value. The number of children and the length of the afternoon have stayed the same while the money to cover them has shrunk.
The names we use show how we understand these programs. Afterschool and out-of-school time names the hours by before and after the school day, and adult day names the hours by the length of a working day. In both cases, the time of children and elders is described by the schedule of an institution they do not belong to.
The Custody of the Laborless
In Deschooling Society, Ivan Illich wrote that one of the hidden purposes of school is custodial care, keeping children in a building so that adults are free to work. Afterschool delivers that custody into the evening, and adult day brings it to the other end of life. We call the first youth development and the second long-term services and supports. Both has its own funding, its own licensing, its own advocates, and its own trade associations. Both do the same work. They hold the people the wage does not count during the hours when the middle generation is at work, and I call those people the laborless.
Children and elders work all the time. Children work at play and at learning, and elders carry the family's memory and stories, cook, and look after the little ones. They are laborless only from the point of view of the paycheck. However, the mere presence of a paycheck determines personhood in Indiana where 43.6 percent of the people served in adult day care are under sixty-five. They are working-age adults with disabilities who spend the day in the same rooms as the elders, and 28.2 percent of them are Black, almost three times of the population that age. The custody of the laborless takes in whoever the labor market leaves out, at any age.
Indiana provides very little care provision for this. In 2020 the state had 50 adult day centers with room for 2,100 people, or 1.9 places for every 1,000 people sixty-five and older, compared with 5.4 places nationally. Set against the 349,105 Indiana elders who live alone, that comes to about 166 elders living alone for every adult day place. For most older Hoosiers who no longer live with family, there is no program to go to during the day.
| Indiana | United States | |
|---|---|---|
| Centers | 50 | about 4,100 |
| Licensed places | 2,100 | 294,000 |
| Places per 1,000 people 65 and older | 1.9 | 5.4 |
| Participants under 65 | 43.6% | 36.7% |
| Participants who are Black | 28.2% | 15.0% |
| Medicaid as a payer | 68.5% (less precise) | 61.8% |
| Centers run for profit | not published | 45.5% |
The places that do exist depend on Medicaid, which pays for 68.5 percent of the people in Indiana's adult day centers, and Congress has approved more than $900 billion in Medicaid cuts over the next ten years. Afterschool has its own federal program, while adult day is a line inside Medicaid. Inside the centers, the national survey of adult day programs finds that each person receives about six minutes of a social worker's time a day.

The staff time in an adult day center goes mostly to aides and activities staff, with nurses next and social workers last. Staff hours measure who is in the building, and they do not indicate quality of service provision, whether consumers sit and wait, make something, or give something to someone else. A review of facility sanctions and code violations would demonstrate the vast spectrum of quality for our most vulnerable neighbors.

Who Has Custody of Our Most Vulnerable
Illich used the term shadow work for the unpaid labor of the household that the wage economy depends on and does not count. Most of that shadow work was done by women. When the young left the grandparents and more women took paid jobs, a large share of it became paid work, still done mostly by women, by people we hire and pay as little as we can.
The typical Indiana wage earner makes $23.07 an hour. A childcare worker makes $11.84, about half of that, and 95 percent of childcare workers are women. Personal care aides, home health aides, and nursing assistants, who do most of the daily care of elders, make between $14 and $18 an hour, and about a quarter of them are Black, roughly three times the Black share of all Indiana workers. Custodial work for our children and our grandparents is done mostly by women, many of them Black women, for wages that leave little room in their own households.

John's picture of a vacuum fits the money as well. Once the elders were drawn out of the household, money moved into the space they left. In Marion County, paid jobs in services for the elderly and people with disabilities grew from 929 in 1998 to 7,704 in 2023, while child day care jobs stayed near 2,900 the whole time. Across the country, 45.5 percent of adult day centers are run for profit. Containing the old has become a growing business, which is not true for afterschool programming.

Job growth for elder care soared passed child day care provision in 2013, and after that elder care kept climbing while child care stayed level. These counts include businesses with paid employees and leave out the self-employed and public programs. Part of the jump after 2021 may come from home care agencies changing how they are classified, so the exact size of the recent rise is less certain than its direction.
The map of Indianapolis shows where this business sits. Washington Township on the north side, where fewer than one in ten residents is poor, has 55 elder-service businesses in the 46240 and 46220 ZIP codes, and it also has the fewest elder-care aides living there, about 15 for every 1,000 workers. On the northwest, west, south, and east sides the rate runs from 23 to 30 aides per 1,000 workers. The 46222 ZIP code on the near west side, where 23 percent of residents are poor and about 4,100 elders live, has no elder-service business at all. The care is managed from the north side and carried out by women who live in the townships around it.

The economically poorest area, Center Township, also has few aides, so the workforce comes mostly from the middle-ring townships, where families are working but not well off. Pike Township on the northwest side has both elder-service businesses and the highest share of aides. These rates rest on a few dozen survey records in each area, so the gaps between neighboring bars are less certain than the gap between the top and the bottom.
| ZIP codes | Children 5 to 14 | Children per child day care business | Adults 65+ | Elders per elder-service business | |
|---|---|---|---|---|---|
| 20% or more | 6 | 28,437 | 508 | 23,050 | 720 |
| 10% to 20% | 12 | 61,614 | 463 | 52,397 | 359 |
| Under 10% | 13 | 43,613 | 582 | 46,468 | 426 |
Putting the Treasures Back
Children need patient adults who have time for them, and elders need to be needed, they need to be loved and listened to. For most of human history those two needs met at the kitchen table, on the porch, and in the yard, and no one was paid for it. Over the last hundred years we separated the two ends of life, put each in its own building, and hired workers at low wages to watch them. Now we hold meetings about the loneliness of older people and about the mental health of young people, and we treat them as two separate problems. It takes a village to raise a child, and elders to build a village. It is little wonder current events are filled with the concerns of a lonley epidemic.
At the Zawadi Exchange we started with the gifts people already had, and the gifts of children and elders were among the easiest to find. A grandfather can fix a bike, fish, cook for a crowd, and tell you where every family on the block came from. A ten-year-old can work the phone her grandfather cannot figure out. Along the way, she still asks the questions most adults have stopped asking. A gift is worthless if there is no one to receive it. Our modern custody system keeps the givers and the receivers in different buildings.
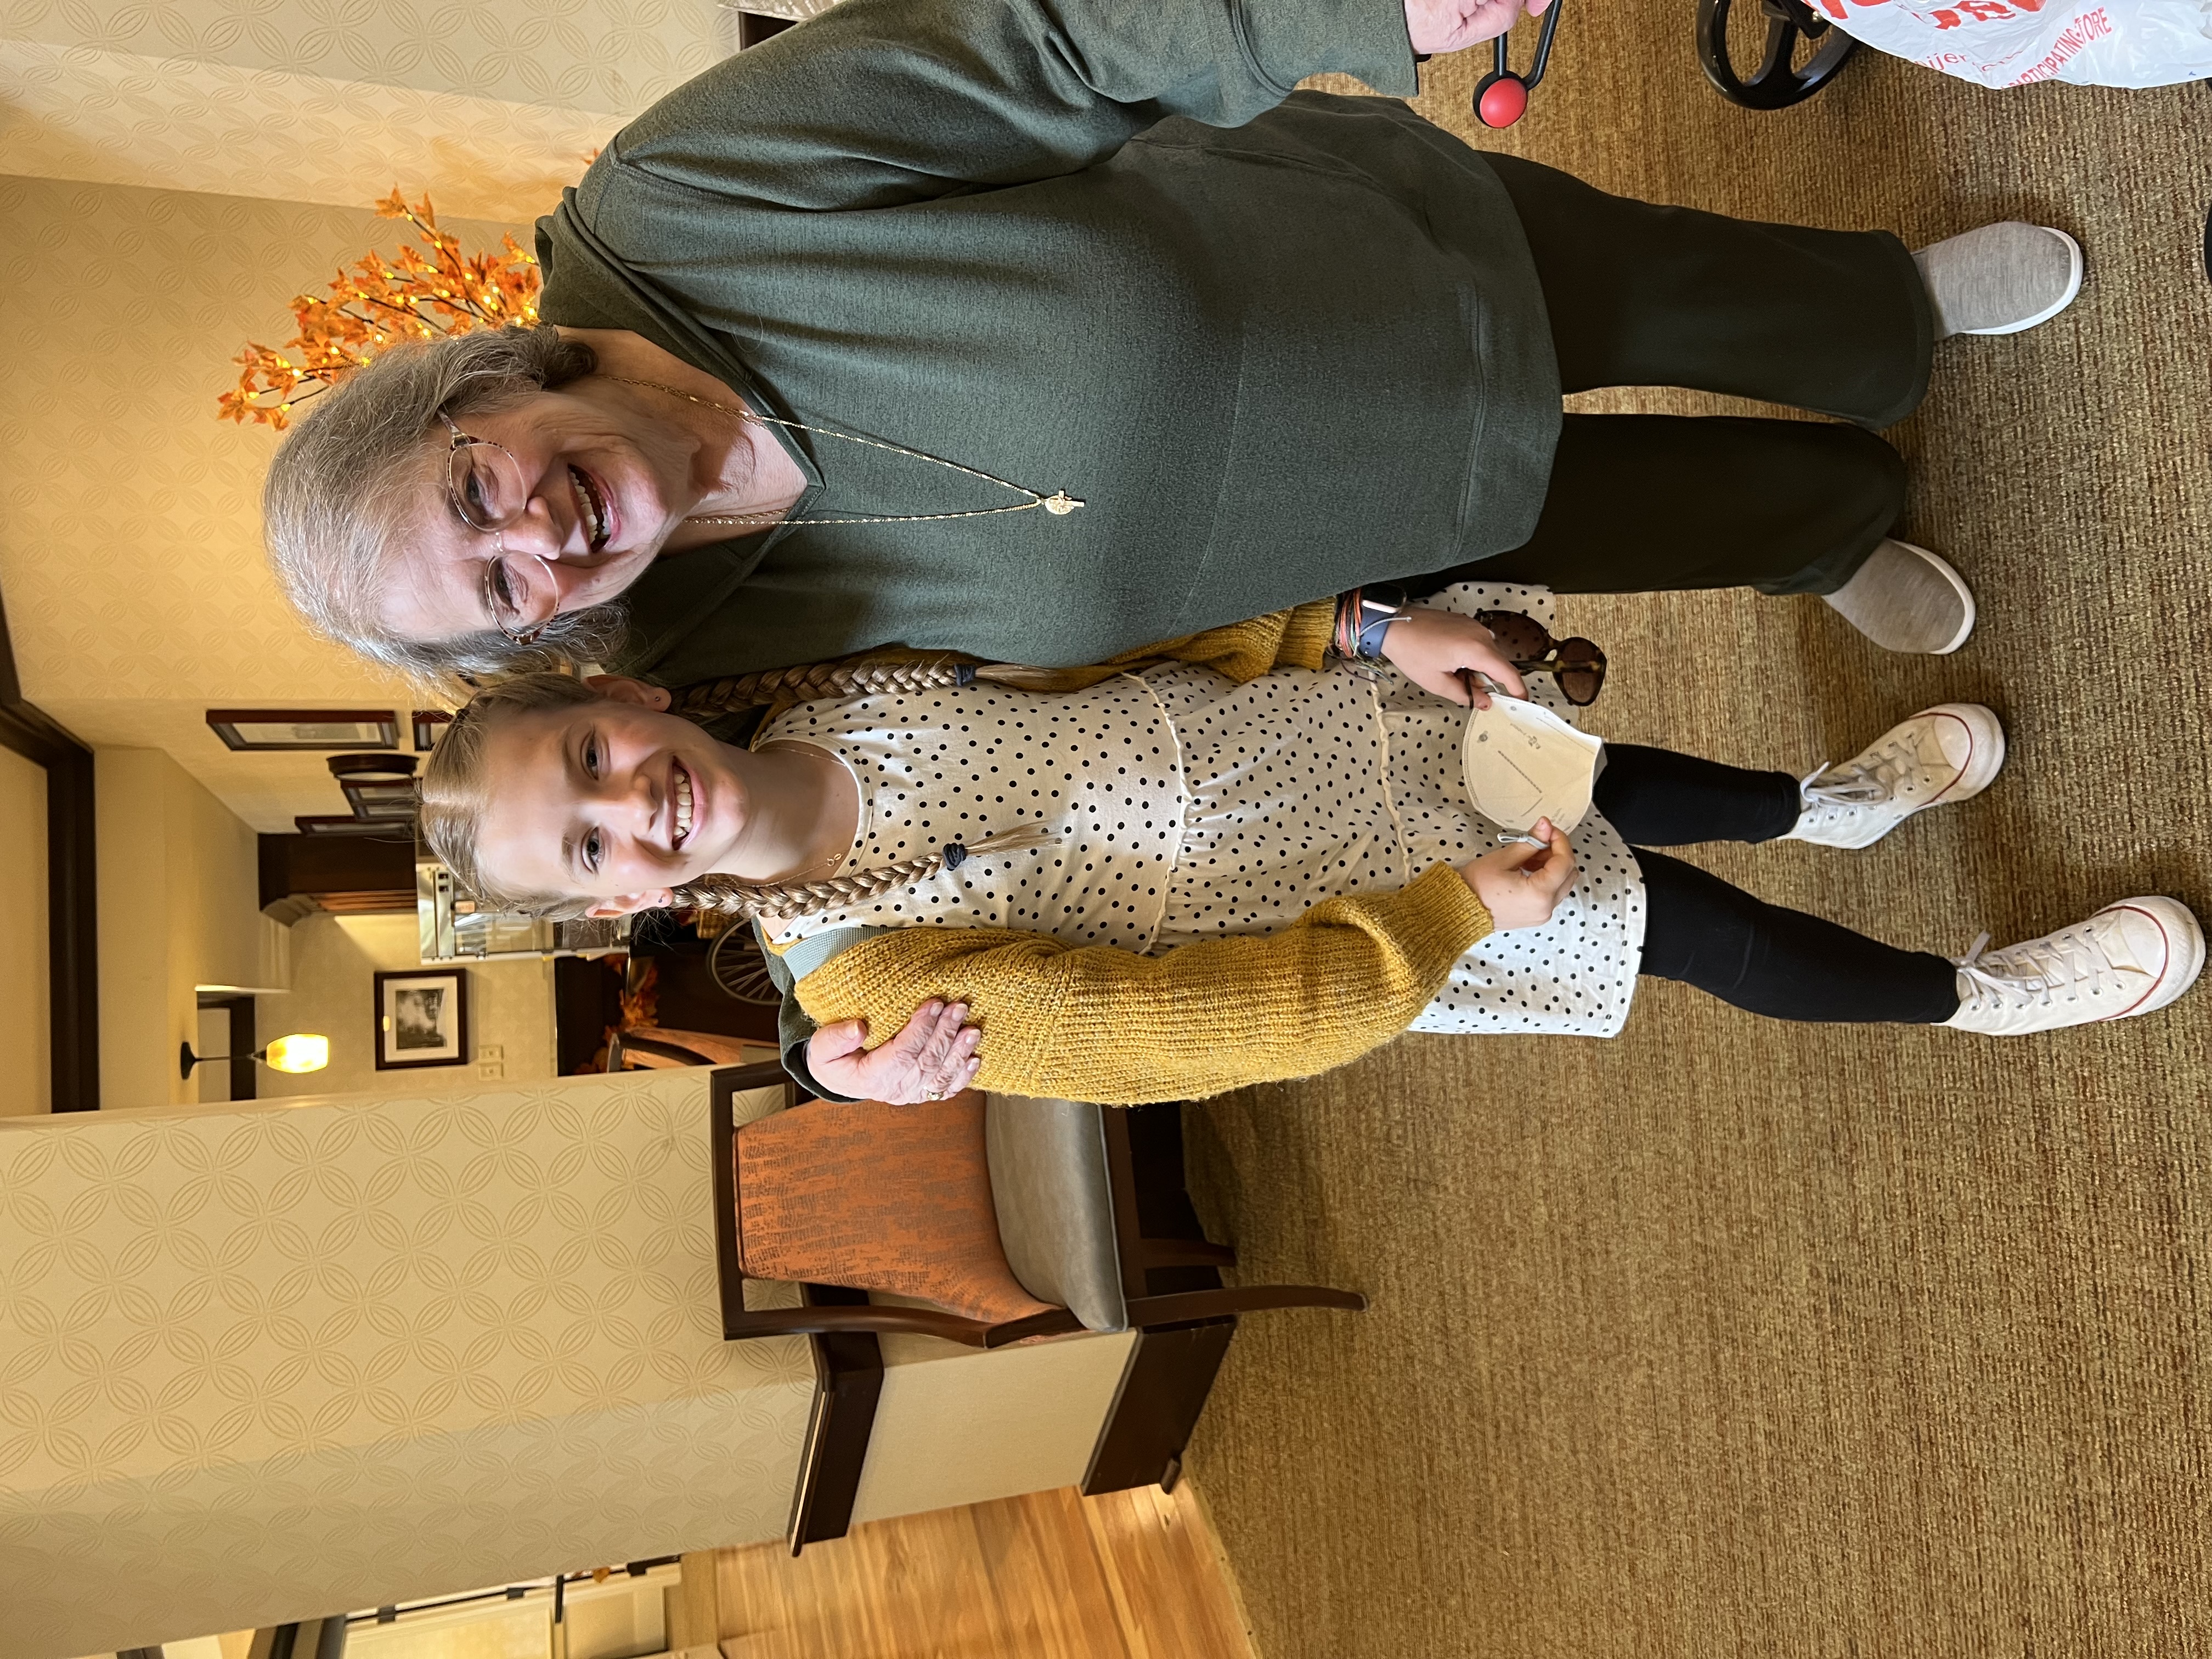
Some places have brought the generations back together, such as the child care center that runs inside Providence Mount St. Vincent, a care home for elders in Seattle. They remain rare because no funding stream in this country exists to pay for one program that serves both ages, and the licensing rules for children and for elders were written as though the two are enemies. People built those walls through budgets and rules over the last century, and we must take them down.
Marion County has 136,000 children and 125,000 elders, and we have arranged our lives so that we rarely see them. We must arrange our lives to live with them again.
How We Did This
Everything in this report comes from free public data that anyone can check. We used the Census Bureau's American Community Survey in two ways. The published tables gave us counts of children, elders, poverty, and living arrangements for the state, the county, each of Marion County's 253 census tracts, and each Indianapolis ZIP code. The survey's microdata, the anonymous answers of individual people, let us do our own math. For Indiana in 2024 we counted elders who share a home with a son, daughter, or child-in-law eighteen or older, which matches the way Ruggles measured it. We estimated hourly pay by dividing each worker's yearly wages by their usual weekly hours and the weeks they worked, and we took the middle value for each job. For where aides live, we used five years of microdata, 2019 to 2023, because one year held too few aides to trust.
We took labor force numbers and the Consumer Price Index from the Bureau of Labor Statistics through the Federal Reserve Bank of St. Louis, and we used the Consumer Price Index to put every afterschool dollar in 2026 terms. Afterschool funding comes from the Afterschool Alliance and the Congressional Research Service. Business and job counts come from the Census Bureau's County Business Patterns and ZIP Code Business Patterns. Adult day figures come from the CDC's National Post-acute and Long-term Care Study, which in 2020 surveyed adult day centers in every state.
What the Data Does Not Say
- Timing is different from cause. The afterschool money arrived after women's work peaked. The government's first reason was from working parents who advocated, but only the congressional debates of 1998 to 2001 can show everything lawmakers had in mind.
- Ruggles's figures for 1950 to 2000 are averages across states, and his 1850 figure is approximate, so the national picture and the Indiana point are close but not identical measures.
- Survey numbers carry error. Several of the wage and aide figures rest on fewer than 100 survey records, and the CDC marks some Indiana adult day figures as less precise.
- The figure of 166 elders living alone for each adult day place sets 2020 adult day places against 2024 elders living alone.
- Business counts show where a business is registered, which can differ from where its workers go each day.
- No dataset here shows what children and elders actually do with their afternoons. That needs people in the rooms, watching and listening, which is the next stage of this work.
Sources
- Steven Ruggles, "The Decline of Intergenerational Coresidence in the United States, 1850 to 2000," American Sociological Review, 2007 (PubMed Central)
- U.S. Census Bureau, American Community Survey: 2024 one-year microdata for Indiana (living with a grown child, wages by occupation), 2019 to 2023 five-year microdata (where aides live), table B09020 (elders living alone), and 2023 five-year estimates by tract and ZIP code
- U.S. Census Bureau, County Business Patterns, Marion County, 1998 to 2023, and ZIP Code Business Patterns, 2023 (child day care, NAICS 624410; services for the elderly and persons with disabilities, NAICS 624120)
- Bureau of Labor Statistics labor force participation for women and men, 1948 to 2026, and the Consumer Price Index, via FRED
- 21st Century Community Learning Centers funding history, Afterschool Alliance, and Congressional Research Service, RL30306, 21st Century Community Learning Centers: A History of the Program, 2002
- CDC National Center for Health Statistics, National Post-acute and Long-term Care Study, 2020 and 2022 (adult day centers, slots, Medicaid, age, race, staff time)
- Vermont Public, "Despite need, the future of adult day programs remains uncertain", 2025 (Medicaid cuts)
- Ivan Illich, Deschooling Society (1971) and Shadow Work (1981)
- Adult day slots are from 2020 and elders living alone are from 2024, so the figure of 166 elders per slot mixes two years.
- Leah Platt Boustan and William J. Collins, "The Origins and Persistence of Black-White Differences in Women's Labor Force Participation", NBER Working Paper 19040, 2013