Abstract
A neighborhood census of this kind is a mirror a block holds up to itself. It is a record kept by the people who are in it. It is a count of dreams where the old counts tallied only wounds. It is a form of local knowledge that never leaves the hands of the people who made it. Most importantly, a neighborhood census is an act of authorship, and authorship, once it is practiced on a block, is very hard to take back.
Three or more neighbors in a census block, a block group, or a small tract come together and decide what matters to them. They build their own indicators through a democratic and trauma-informed process, they act on those indicators together, and they judge their own wins in the forms that tell the truth about their lives, whether that is a story, a photograph, a video, a poem, or a column of numbers. The data they produce they keep, govern, and own. Blocks that want to can roll their indicators and their outcomes up to a neighborhood, a city, a region, a state, and a nation, and at every step a block holds back whatever it does not wish to send. The whole thing stands next to the federal decennial census and never tries to replace it. The case for it draws on the history of who gets counted, the long argument over deficiency and gifts, the new economy of data extraction, the Indigenous movement for data sovereignty, the governance of commons, and a hundred years of neighbors who have counted themselves.
Authorship, once it is practiced on a block, is very hard to take back.
The Wound We Can Measure
Every ten years the country counts itself, and every ten years it misses the same people. The Census Bureau's own review of the 2020 count, its Post-Enumeration Survey, found that the census missed Black residents by 3.30 percent, Hispanic residents by 4.99 percent, and American Indian and Alaska Native residents on reservations by 5.64 percent, and counted the non-Hispanic White population 1.64 percent too high (U.S. Census Bureau, 2022). Renters and young children were undercounted while homeowners and older adults were overcounted. The miss travels along the lines of race, of poverty, and of who rents and who owns, which are the same lines that segregation drew in the first place.
Those lines were drawn, in good part, with a map. In the 1930s the federal Home Owners' Loan Corporation graded the neighborhoods of more than two hundred American cities from A to D, colored the D neighborhoods red, and wrote the racial makeup of a block directly into the reason for its grade (Nelson et al., 2016). Economists who compared addresses on either side of those grading lines found the maps pushed down homeownership, home values, and integration for decades after (Aaronson, Hartley, & Mazumder, 2021). Of the neighborhoods marked "Hazardous" in the thirties, roughly three quarters are still low-to-moderate income and nearly two thirds are still neighborhoods of color (Mitchell & Franco, 2018). The harm even reaches the weather. Across 108 American cities, the formerly redlined neighborhoods run hotter than the formerly favored ones, by about 2.6 degrees Celsius on average and in some places far more, because they were given less tree canopy and more pavement (Hoffman, Shandas, & Pendleton, 2020). A line drawn on a map in 1935 is still raising the temperature on somebody's porch this summer.
A neighborhood that was counted as hazardous and is still being undercounted has been losing on the national ledger for ninety years. A census the neighbors run themselves answers both halves of that at once. It fills in what the official count leaves out, and it is written by the very people the old maps wrote off.
The Politics of Being Counted
Counting was power in America before it was anything else. The Constitution tied political representation to a head count that rated an enslaved person at three-fifths and left "Indians not taxed" out of the reckoning entirely (U.S. Const. art. I, § 2). From the first federal census forward, who got counted, and as how much of a person, was the machinery that handed out seats and money.
James Scott put a name to the state's hunger to count. Studying the great schemes by which governments have tried to see the people they rule, he called the thing they are after legibility, the flattening of a complicated living place into something simple enough to tax and conscript from a capital far away, and against it he set the word mētis, the practical, unwritten knowledge that belongs only to the people who actually live the life in question (Scott, 1998). The federal census is a legibility machine built to see the nation from the top. What it cannot gather, by its very design, is the mētis, and the mētis is exactly what the people on the block carry.
Theodore Porter found that institutions reach for numbers precisely when trust runs short, that quantification is how strangers decide things about one another without anyone having to know anyone (Porter, 1995), and Ian Hacking showed that the flood of official statistics in the nineteenth century did not merely describe populations, it invented the categories that then told people who they were, so that the counting itself began to produce the very kinds of people it claimed only to count (Hacking, 1990). Porter and Hacking together land on one truth, that whoever writes the categories writes the people. Categories handed down from above make a neighborhood legible to the state. Categories written on the block make the neighborhood known to itself. That is the reason the neighbors have to author their own indicators, because the authorship of the question decides the answer.
This has been done, and done beautifully, for more than a century. In the summers of 1896 and 1897, W. E. B. Du Bois walked the Seventh Ward of Philadelphia house by house, sat with thousands of Black residents in their own front rooms, and produced The Philadelphia Negro, a study so careful it printed its own interview schedules in the back and colored a map by the condition of every household (Du Bois, 1899). White reformers had commissioned it, Du Bois graded families by his own stern lights, and his collaborator Isabel Eaton went uncredited for generations, so the work was no clean miracle. It proved the one thing this program is built on anyway. A community can study itself with more rigor, more accuracy, and more love than any stranger has ever brought to studying it from outside.
Whoever writes the categories writes the people.
The Deficiency Census and the Dreams Census
For thirty years the ruling way to know a poor neighborhood has been to survey it for what it lacks. John McKnight and John Kretzmann gave that practice its true name. They described the standard community needs survey for what it does, tallying up everything a person and a place are missing, and they showed that once that map of lack is taken for the whole truth it decides everything downstream, because data about deficiency can only justify programs about deficiency, run by outside providers, for people who have been turned into clients (Kretzmann & McKnight, 1993). McKnight later gave the whole arrangement its bluntest name, the careless society, a place where paid service has quietly shoved aside the care neighbors once gave each other for free (McKnight, 1995).
Ivan Illich had seen the engine under it a generation earlier. His argument was that any tool or institution, past a certain scale, begins to defeat the very thing it was built for, and that a profession does its deepest damage when it wins what he called a radical monopoly, the point at which the professional service has crowded out ordinary human competence so thoroughly that a person's own ability to do the thing himself starts to look illegitimate (Illich, 1973). Measurement has become one of those radical monopolies. The consultant's assessment, the proprietary index, the risk score cooked up in an office downtown, each one says to a resident that his own knowledge of his own street is not real knowledge. Illich's answer was the convivial tool, the tool a person can pick up, understand, use, change, and set down again, and a census the neighbors run is a convivial tool, a way of knowing the block that the block can actually hold in its hands.
The asset-based approach McKnight and Kretzmann built flips the survey over and asks what a person is good at and what she has to give, and it treats those answers as the raw material of real community. This program carries that flip one step further. The gifts are what a block already holds, the capacities that are present right now, and a dream is what the block is reaching for, the thing it would build if it could. The question moves from what is wrong with you to what are you good at and what do you dream of, and the instrument takes its name from what it is built to find. It is a dreams census. It counts the gifts in order to gather the dream, and the instant the question changes, the person on the other side of it stops being a case and becomes an author.
The instant the question changes, the person on the other side of it stops being a case and becomes an author.
The New Extraction
While the service system was busy counting wounds, a far bigger counting operation was being built, and this one was made to take. Nick Couldry and Ulises Mejias call it data colonialism, an order that pulls human life itself into data, on and on without end, and they mean the word colonialism plainly, not as a figure of speech, because the order marries the extractive habit of the old colonialism to the quantifying machinery of the computer (Couldry & Mejias, 2019). Shoshana Zuboff describes the commercial engine of the same thing, a surveillance capitalism that takes what people do and feel as the free stock of a business, converts it into data about their behavior, and sells the predictions it squeezes out of that data to whoever will pay (Zuboff, 2019). Cedric Robinson's older account of racial capitalism explains why all of this falls hardest on the very neighborhoods the redlining maps marked, since capitalism has always grown by sorting people into races and pricing them accordingly, and the HOLC grade that once turned a block's color into a financial category has simply handed the job to a data broker's score (Robinson, 1983).
Your block is already being counted. The traces off the phones, the images off the doorbell cameras, the analytics the real-estate platforms run on every parcel, all of it is a census of your neighborhood that you never authorized, cannot see, and do not own. The question was never whether the block would be measured. The question is who holds the measure, and for whose good.
What It Means for a Neighborhood to Own Its Data
The most developed working model of community-owned data in the world was built by Indigenous peoples, and this program should sit down and learn from it. The field is called Indigenous data sovereignty, and its founding claim, grounded in the United Nations Declaration on the Rights of Indigenous Peoples, is that a people holds the right to govern the collection, the ownership, and the use of data about itself (Kukutai & Taylor, 2016). Out of that movement came the CARE Principles for Indigenous Data Governance, four commitments named Collective benefit, Authority to control, Responsibility, and Ethics, written to stand beside the technical "FAIR" principles that had pushed the research world to make its data easy to find, reach, and reuse (Carroll et al., 2020). CARE answers that openness with no authority to control is just a politer word for extraction. First Nations in Canada built the same conviction into a set of principles they call OCAP, for Ownership, Control, Access, and Possession, and in it they draw the distinction this program needs most, the one between owning data in principle and possessing it in fact, between holding the title and holding the thing itself on your own ground (First Nations Information Governance Centre, n.d.).
The idea has to be borrowed with two honest limits. Indigenous data sovereignty rests on inherent sovereignty and on treaty, a standing in law that neighborhoods simply do not have, so when this program speaks of neighborhood sovereignty it means self-government over knowledge and nothing like tribal nationhood, it borrows the principles with open credit and real care, and it never overrides tribal authority where a neighborhood sits on or beside Native land. The second limit is in the word ownership itself. Salomé Viljoen has shown that treating data as a thing one person owns and can sell is a dead end, because the value and the harm of data are not individual but run through whole populations, so letting each person sell her own record does nothing to touch the real power, and what justice actually requires is the democratic governance of data relations (Viljoen, 2021). Neighborhood data ownership, then, means ownership in the collective, OCAP sense, the block governing its information together and holding it on its own ground, and it never means a marketplace where neighbors sell themselves one row at a time.
How It Rolls Up Without Becoming a New Machine
The fair objection to all of this is that thousands of separate block-level counts, stacked into a city and then a nation, would just rebuild the top-down legibility machine the program set out to escape. Elinor Ostrom spent a career on a version of that worry. She studied communities that had governed shared resources successfully for generations, forests and fisheries and irrigation systems, and found a handful of design principles the lasting ones held in common, the last of which, nested enterprises, is nearly a blueprint here, because it describes how small self-governing units bind into larger ones without the large ones swallowing the small (Ostrom, 1990). Another of her principles tells the program what to ask of government, which is the minimal recognition of the right to organize, recognition and not control. Her later work on knowledge as a commons carries the point into data directly, treating shared information as a resource a community can hold together against the twin dangers of enclosure, where an outside power captures it, and degradation, where it goes stale or gets gamed (Hess & Ostrom, 2007).
So the roll-up is voluntary at every rung. A single block's census is whole on its own, and most of its worth stays on the street that made it. When a block decides to share an indicator and an outcome, those rise to join a neighborhood picture, the neighborhood pictures join a city picture, the city joins a region, the region a state, the state a nation, and at each fold the block keeps back whatever it chooses. What rises is only what the neighbors consented to send, so the national picture becomes consent repeated at every level, showing two things at once, the work that blocks share across the whole country and the work that belongs to one street alone.
The Old Threat in a New Coat
Redlining was a data practice. It was a grading of neighborhoods written onto a map, and its grandchild is alive in the machinery of the present, which is the whole reason a block has to hold its own data close. Chris Gilliard named the grandchild digital redlining, the policies and investments and designs that enforce class and racial lines through technology, and he drew the sharp line that matters, that the digital divide is a noun while digital redlining is a verb, the active doing of discrimination through data (Gilliard, 2017).
A shelf of recent work has documented the doing. Safiya Noble showed how commercial search engines bake racism and sexism into the results they hand back about whole groups of people (Noble, 2018). Ruha Benjamin named the wider pattern the New Jim Code, new tools that carry forward old injustice while wearing the face of neutrality and even progress (Benjamin, 2019). Virginia Eubanks followed automated systems into the lives of poor Americans and found a digital poorhouse built of databases and risk models, including a welfare system in Indiana engineered to deny and a tool that scored families for the risk of removing their children (Eubanks, 2018). Cathy O'Neil showed how opaque scoring models scale harm across millions at once, and how a zip code does the quiet work of standing in for race (O'Neil, 2016). Linnet Taylor gathered these worries into what she calls data justice, the idea that people deserve fairness in how they are seen and sorted through the data they give off, and she named the knot this program has to untie, that an undercounted neighborhood needs more visibility to claim what it is owed and more control of that visibility to keep from being surveilled (Taylor, 2017). The right to be counted and the right to refuse the count have to arrive together, and a block that owns its own data holds both.
The right to be counted and the right to refuse the count have to arrive together.
The Lineage This Program Belongs To
A block is likelier to pick up a tool that has a history it can see, and this one has a long one. In 1895 the residents of Hull House in Chicago took a federal wage survey of their own district and turned it into house-by-house maps of nationality and income, modeled on Charles Booth's poverty maps of London, and then used the maps to plan the settlement's own work (Residents of Hull-House, 1895). Four years later Du Bois walked the Seventh Ward. In the 1970s the Chicago organizer Gale Cincotta and her allies forced the federal government to make banks disclose where they would and would not lend, winning the Home Mortgage Disclosure Act in 1975, and then they took the disclosed numbers and used them to win the Community Reinvestment Act in 1977, a law that armed neighborhoods with the data to demand reinvestment (Marchiel, 2020). That is the clearest proof in American history of this program's theory of change, organizers who forced the data into the open and then used the data to move the money.
The line runs right up to now. In 2018 the Our Data Bodies project worked in Charlotte, Detroit, and Los Angeles to document how surveillance and data collection were tied to people losing their benefits, their housing, and their jobs, and it did the documenting as a matter of research justice, with and for the communities themselves (Petty, Saba, Lewis, Gangadharan, & Eubanks, 2018). That same year Catherine D'Ignazio and Lauren Klein set down the principles of data feminism, which begin by examining how power works and include a chapter whose four-word title is the entire argument, "What Gets Counted Counts" (D'Ignazio & Klein, 2020). Miranda Fricker gave the underlying injury its name, hermeneutical injustice, the wrong done to people when a real part of their own experience is kept out of the shared store of understanding (Fricker, 2007). A neighborhood never allowed to author its own account of itself is living inside that injustice, and the dreams census is a way out of it.
The Objections, Met Honestly
Four real objections come with this program, and none of them should be dodged.
The first is that asset-based work can become a cover for cutting public budgets. Mary Anne MacLeod and Akwugo Emejulu argued exactly that, that asset-based development can slide into a neoliberalism with a community face, a way of telling neighborhoods to make do with their own gifts while the state walks away from what it owes them (MacLeod & Emejulu, 2014). The dreams census answers by never traveling alone. It rides alongside the needs data that back a neighborhood's claim on public money, and the Community Reinvestment Act fight is the proof that deficit data, lending gaps and service gaps, become a weapon the moment the community controls them. A dreams census does not retire the fight for resources, it arms it.
The second objection is the one Viljoen already pressed, that ownership of data by individuals is a propertarian dead end. The program takes the point and builds on it, keeping ownership collective and democratic in the OCAP sense, governance and possession and the authority to control, and refusing any market in which a neighbor sells her own record.
The third objection is that a neighbor-owned census could shut out the very people it means to serve. Neighborhood lines were themselves drawn by covenants and by the redlining maps, and a census run by established homeowners, who are already the overcounted ones, could leave out renters, newcomers, and undocumented residents. Ostrom's principle of clearly defined boundaries cuts both ways, so the program has to answer it in the open, defining the counting group as wide as the people actually living in the place and treating the renter and the newcomer as full authors of the block's account.
The fourth objection is the deepest. A neighborhood's own data could become the surveillance it was built to resist, subpoenaed or scraped or sold, and any standardized roll-up risks turning into a fresh version of Scott's legibility machine. The safeguards are the design itself, the right to refuse, data held locally in the OCAP sense before any of it travels, thresholds that protect individuals inside the aggregate, and a clear standing beside the federal census rather than in place of it, so the legal protections of the official count are never bargained away. The program earns trust by refusing to do to neighborhood data the thing it accuses the apparatus of doing.
Program Hypothesis
If neighbors are asked what they are good at and what they dream of, rather than only what they lack; and if neighbors themselves write the indicators that measure their own collective dream; and if neighbors act on those indicators together and judge their own wins in the forms that tell the truth about their lives; and if the data they produce is held, governed, and owned by the block that produced it; and if blocks roll their work up to one another only by consent, keeping back whatever they choose; then power will begin to move, because data is power and the data will belong to the neighbors, the practice of data sovereignty will take root on the ground, unity and collective action will grow at the smallest scale and ripple outward through the neighborhood and the city and the nation, neighbors will come to understand digital redlining and to claim a digital liberty, and a democracy built from the bottom, block by block, will begin to remember how to govern itself.
The Outcomes This Program Seeks
It moves power, because data is power. Every decision made about a neighborhood from the outside rests on somebody's numbers, and for a generation those numbers have belonged to the agencies, the funders, and the firms, which means the power has belonged to them too. A block that owns its own count holds a piece of that power for the first time, and a nation of blocks that own their counts has moved a great deal of it back toward the ground.
It builds the practice of neighborhood data sovereignty. Sovereignty here is a habit people build by doing it, the standing practice of a block deciding what it will gather about itself, how it will hold it, and who may ever touch it. A neighborhood that has governed its own data for three years has a muscle no outside operation can take away.
It grows unity and collective action, and the growth ripples outward. A block that counts its own dream and works its own list comes to know itself as one body, and that is where collective action is born, among people who can see one another's porches. The strength made at that smallest scale moves out into the neighborhood, the city, and the nation, block by block, until the ripple is national, and it started on a single street.
It teaches digital redlining and names a digital liberty. When neighbors manage their own data they learn fast how the digital world sorts them, how an address becomes a score and some streets get served while others get written off. Running their own census puts those tools in their hands, and a block that holds its own data and shares its own prosperity on its own terms is making an abolitionist claim, that the prosperity was always meant to be shared, and refusing the sorting built to deny it.
It grows democracy from the bottom. A block that decides together what to count, acts together on what it finds, and judges its own wins has been practicing direct democracy the whole time without naming it. Scaled up through the roll-ups, street by street and city by city, the country builds the habit of governing itself from the ground, the oldest American promise and the one most often put off, and it could carry us toward a direct democracy that begins where people actually live.
The Prototype Is Already Running

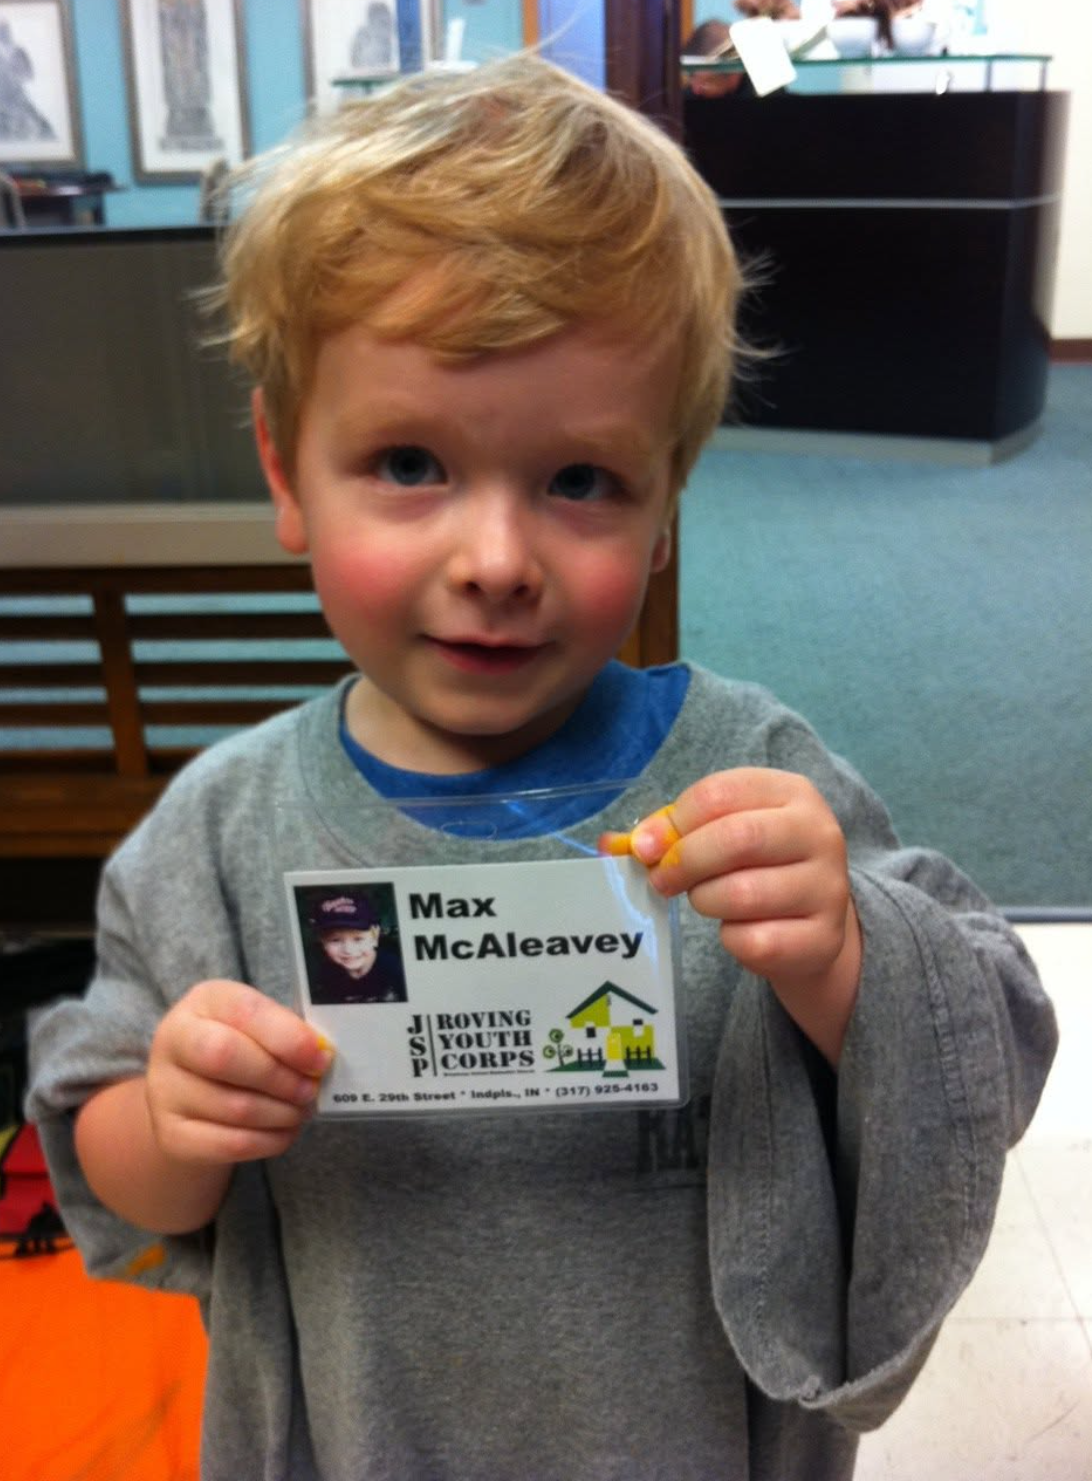
None of this waits to be invented. On Broadway in the Midtown of Indianapolis, Mike Mather, De'Amon Harges, Karen McAleavey, a great many neighbors, and I built the Zawadi Exchange by hand, with index cards and conversations, a dreams census run door to door by a Roving Listener who asked people what they were good at and what they dreamed of and then connected them to one another. In Mapleton-Fall Creek the neighbors are now building the continuous version of it, a census that never closes, held on infrastructure the neighborhood controls and governed by the people on the blocks. The National Neighborhood Census Program is that prototype offered to every neighborhood in the country, three neighbors at a time, counting what they love, keeping what they count, and handing up only what they choose. The gifts are already on the block. This is the count that finally lets the block keep them.
The gifts are already on the block. This is the count that finally lets the block keep them.